Considered for the case with a good zero wire. Vector diagrams of voltages and currents are given in Figures 15 and 16; Figure 17 shows the combined current and voltage diagram.
1. The axes of the complex plane are constructed: real values (+1) - horizontally, imaginary values (j) - vertically.
2. Based on the values of the current and voltage moduli and the sizes of the fields of the sheets reserved for building diagrams, the current scales mI and voltage mU are selected. When using A4 format (dimensions 210x297 mm) with the largest modules (see Table 8) of current 54 A and voltage of 433 V, the scales are taken: mI = 5 A / cm, mU = 50 V / cm.
3. Taking into account the adopted mI and mU scales, the length of each vector is determined if the diagram is constructed using the exponential form of its recording; using an algebraic form, the lengths of the projections of the vectors on the axes of real and imaginary quantities are found, i.e. the lengths of the real and imaginary parts of the complex.
For example, for phase A:
The length of the current vector / f.A / = 34.8 A / 5 A / cm = 6.96 cm; the length of its real part
I f.A = 30 A / 5 A / cm = 6 cm,
the length of its imaginary part
I f.A = -17.8 A / 5 A / cm = - 3.56 cm;
The length of the voltage vector / A load / = 348 V / 50 V / cm = 6.96 cm; the length of its real part
U A load. = 340.5 V / 50 V / cm = 6.8 cm;
the length of its imaginary part
U Anagr. = 37.75 V / 50 V / cm = 0.76 cm.
The results of determining the lengths of vectors, their real and imaginary parts are reflected in table 9.
Table 9 - Lengths of current and voltage vectors, their real and imaginary parts for the case of an intact neutral wire.
| Magnitude | Scale, 1 / cm | Vector length, cm | The length of the real part, cm | The length of the imaginary part, cm | |
| Mains phase voltage | U A | 50 V / cm | 7,6 | 7,6 | |
| UB | 7,6 | - 3,8 | - 6,56 | ||
| UC | 7,6 | - 3,8 | 6,56 | ||
| Voltage phase load | U Anagr. | 50 V / cm | 6,96 | 6,8 | 0,76 |
| UV loading | 7,4 | - 4,59 | - 5,8 | ||
| US load | 8,66 | -4,59 | 7,32 | ||
| U0 | 1,08 | 0,79 | - 0,76 |
Continuation of table 9
| Load phase currents | I f.A. | 5 A / cm | 6,96 | 6.0 | - 3,56 |
| I f.V | 7,4 | 1,87 | - 7,14 | ||
| I f.C | 3,13 | 0,1 | 3,12 | ||
| I 0 | 10,8 | 7,9 | - 7,6 |
4. Construction of the vector stress diagram.
4.1 On the complex plane are constructed the phase voltage vectors of the supply network A, B, C; having connected their ends, receive vectors of linear tension of AV, VS, SA. Then the vectors of phase voltages of load A are built., B is loaded., C is loaded. To build them, you can use both forms of recording complexes of currents and voltages.
For example, vector A load. is constructed in an exponential form as follows: from the axis +1 at an angle of 6 10, i.e. counterclockwise, a length of 6.96 cm is deposited; in algebraic form, it can be constructed by laying on a +1 axis a length of 6.81 cm, and on a + j axis a length of 0.76 cm, the ends of these segments are the coordinates of the end of vector A load.
4.2. Because linear load voltages are set by the mains; in order to determine the position of the load neutral it is necessary to carry out parallel transfer of the phase voltage vector of the load A load., B load., C load. so that their ends coincide with the ends of the phase voltages of the supply network.
Point 0, which will be their beginning, there is a neutral load. At this point is the end of the neutral bias voltage vector 0, its beginning is located at point 0. This vector can also be constructed using the data in Table 9.
5. Construction of the vector current diagram.
5.1 Construction of vectors of phase load currents of ph. A, f. B, f. C is similar to the construction of vectors of phase voltages.
5.2 By the addition of the phase current vectors is the current vector in the neutral wire 0; its length and the lengths of its projections on the axes must coincide with those indicated in table 8.
The vector diagrams of currents and voltages for the case of a broken zero wire are constructed similarly.
It is necessary to analyze the results of the calculation and construction of vector diagrams and draw conclusions about the effect of load asymmetry on the magnitude of its phase voltages and on the neutral voltage; special attention should be paid to the consequences of breaking the neutral wire network with an asymmetrical load.
Note. It is allowed to combine the diagrams of currents and voltages, provided they are made in different colors.
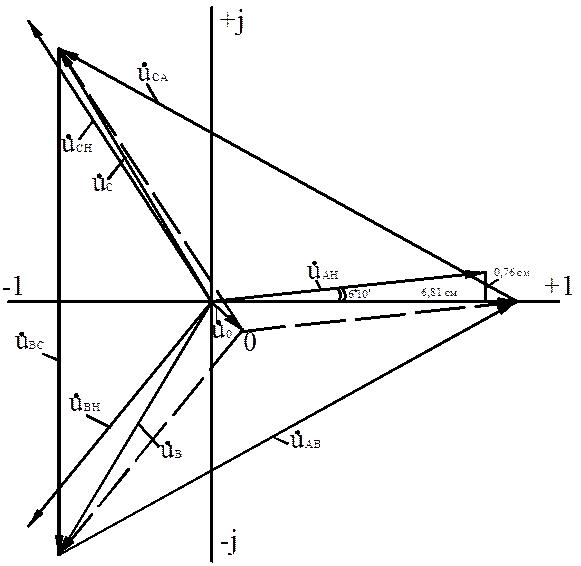
Figure 15. Vector stress diagram
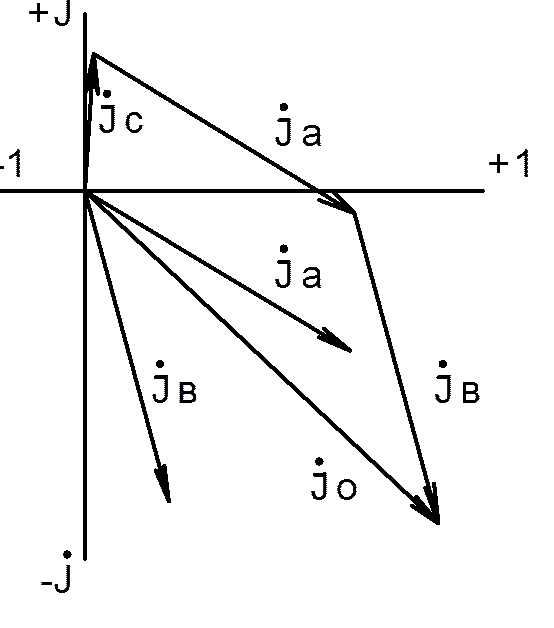
Figure 16. Vector current diagram.
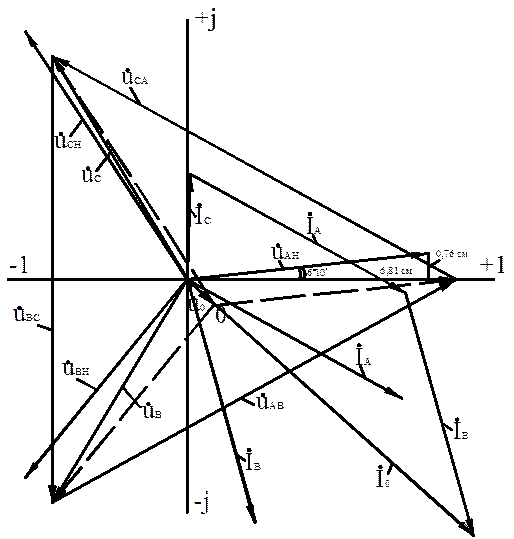
Figure 17. Combined vector diagram of voltages and currents.
Figure 25 - Vector diagram of currents in the short circuit point
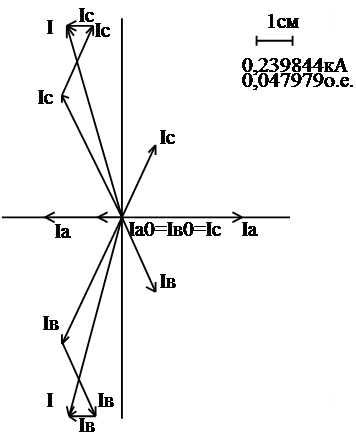
Figure 26 - Vector diagram of currents in section AA
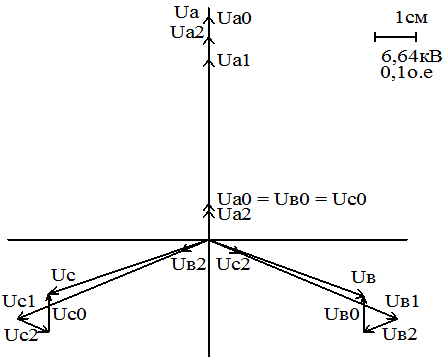 |
Figure 27- Vector diagram of stresses in section AA
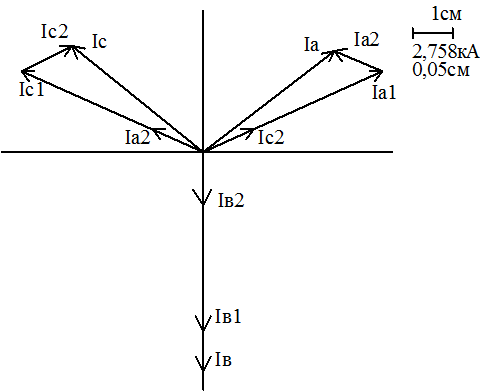 |
Figure 28 - Vector diagram of currents in section bb
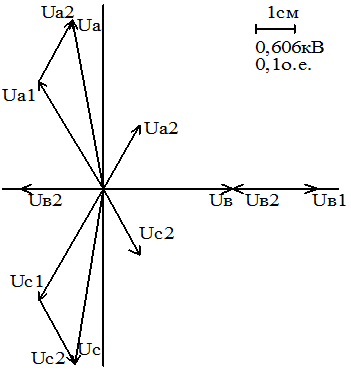 |
Figure 29 - Vector diagram of the stresses of the cross section bb
Calculation of the periodic component of short-circuit current by the method of typical curves.
Task III. Calculation of the periodic component of the current three-phase short-circuit
The method of typical curves.
In determining the periodic current of a three-phase short circuit, a direct sequence diagram is drawn up for the initial moment of time at which the generators are represented by super-transition parameters; loads are not taken into account (Figure 2). The general method of calculation is described in After equivalenting, an intermediate scheme was obtained (Figure 30), which is converted to a radial view relative to the short-circuit point (Figure 31). In this case, current distribution coefficients are used.
In the process of simplifying the equivalent circuit, the following resistances were obtained: X 15 = X 1 + X 2/2 = 0 + 0.975425 / 2 = 0.4877125 p.u.
X 16 = X 4 + X 5 = 0.84 + 1.53 = 2.37 pu
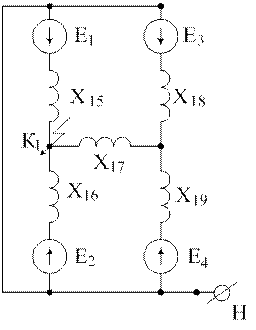
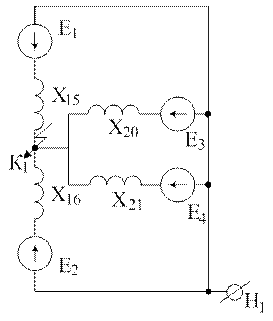
Figure 30- Intermediate scheme Figure 31- Design scheme
X 17 = X 6 + X 7 = 0.88 + 0 = 0.88 pu
X 18 = X 11 + X 9/2 = 0 + 1.240076 / 2 = 0.620038 pu
X 19 = X 12 + X 13 = 2.117202 + 0.192308 = 2.30951 pu
X EC = X 18 * X 19 / (X 18 + X 19) = 0.620038 * 2.30951 / (0.620038 + 2.30951) = 0.488807 pu
C 1 = X EC / X 18 = 0.488807 / 0.620038 = 0.78835.
C 2 = EC / X 19 = 0.488807 / 2.30951 = 0.21165.
X 20 = (X eq + X 17) / C 1 = 1.736294 pu
X 21 = (X eq + X 17) / C 2 = 6,467324 p.e.
The circuit shown in Figure 31 is obtained. Next, the initial periodic currents are located at the fault location.
I "T = E 2 / X 16 * I B = 1.13 / 2.27 * 2.5102 = 1.196846 kA.
I "C1 = E 1 / X 15 * I B = 1 / 0.4877125 * 2.5102 = 5.146885 kA.
I "C2 = E 3 / X 20 * I B = 1 / 1.736294 * 2.5102 = 1.445723 kA.
I "C3 = E 4 / X 21 * I B = 1 / 6.467324 * 2.5102 = 0.388136 kA.
The currents from the systems are constant. The periodic current, according to standard curves, is determined for a synchronous generator with a thyristor or high-frequency excitation system. In accordance with the method, the rated current of the synchronous generator is calculated, and then the number of the typical curve is determined.
I GN = S GN / * U B = 100 / (* 0.85 * 230) = 0,295320 kA;
I * PO = I G2 "/ I GN = 1.196846 / 0.295320 = 4.05" 4.
Since the ratio I G2 "/ I GN" 4, then selects 4 typical curve:
I KZPOST = I "C2 + I" C3 + I "C1 = 5.1468885 + 1.445723 + 0.388136 = 6.980748 kA
| t, sec | 0,1 | 0,2 | 0,3 | 0,4 | 0,5 | |
| I G t / I ”G, о.е | 0,85 | 0,78 | 0,755 | 0,75 | 0,745 | |
| I G t, kA | 1,1968 | 1,017 | 0,933 | 0,903 | 0,897 | 0,891 |
| Total I K t, kA | 8,1775 | 7,9977 | 7,9137 | 7,8837 | 7,8777 | 7,872 |
As an example, consider finding a periodic current for a point in time of 0.1 seconds. Curve 4 for this moment of time determines the ratio In, t, g / Inog = 0.85.
The effective value of the periodic component of the short-circuit current from the generator is determined: In, t, g = 0.85 * Ino * I NOM = 0.85 * 4.05 * 0.2953 = 1.017 kA.
The total periodic current at K (3) in the node K, taking into account typical curves, is shown in Figure 32.

Figure 32- Graph of the dependence of the total periodic current on the fault time Ikt = f (t)
Task IV. Calculation of the periodic component of the current asymmetrical short-circuit by the method of typical curves.
To determine the periodic short-circuit currents at К (1.1) using the method of typical curves, a negative sequence replacement scheme is made without taking into account the loads (Figure 33). Next is the simplification of the equivalent circuit and obtaining the equivalent resistance of the negative sequence. The sequence of simplifications is shown below and in figures 34-37.
X 15 = X 1 + X 2/2 = 0 + 0.975425 / 2 = 0.487713 pu X 16 = X 4 + X 5 = 0.84 + 1.87 = 2.71 pu.
X 17 = X 6 + X 7 = 0 + 0.88 = 0.88 pu X 18 = X 11 + X 9/2 = 0 + 1.240076 / 2 = 0.620038 pu
X 19 = X 12 + X 13 = 2.117202 + 0.230769 = 2.347971 pu.
X 20 = X 15 * X 16 / (X 15 + X 16) = 0.487713 * 2.71 / (0.487713 + 2.71) = 0.413327 pu
X 22 = X 17 + X 21 = 0.88 + 0.490508 = 1.370508 pu X EC2 = X 20 * X 22 / (X 20 + X 22) = 0.413327 * 1.370508 / / (0.413327 + 1.370508) = 0.317556 pu

Figure 33 - The negative sequence

Figure 34- Simplification scheme №1

Figure 35- Simplification scheme number 2
Figure 36- Simplification scheme number 3

Figure 37- Equivalent equivalent reverse pattern
Sequences
Similarly, we draw up a zero sequence replacement scheme (Figure 38). The procedure for simplifying the replacement scheme is shown below in Figures 39-42.
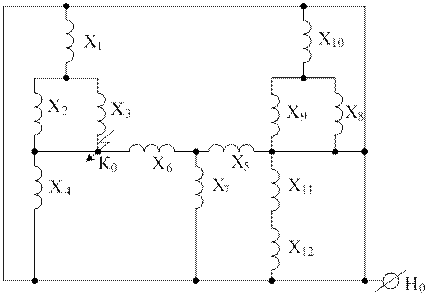
Figure 38 - Calculated zero sequence replacement scheme
X 13 = X 1 + X 2/2 = 0 + 4,585 / 2 = 2,292 pf X 14 = X 10 + X 9/2 = 0 + 6.82 / 2 = 3.41 pu.
X 15 = X 11 + X 12 = 7.41 + 0.769 = 8.18 pu X 16 = X 13 * X 4 / (X 13 + X 4) = 2.29225 * 0.84 / (2.29 + 0.84) = 0.615 pu
X 18 = X 6 + X 17 = 0.88 + 1.338581 = 2.219 pu
X 17 = 1 / (1 / X 7 + 1 / X 15 + 1 / X 14) = 1 / (1 / 3,016 + 1 / 8,18 + 1 / 3,41) = 1.34 in.e.
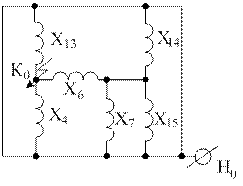
Figure 39- Simplification scheme №1
 Figure 40- Simplification scheme №2
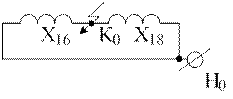
Figure 41 - Simplification scheme number 3

Figure 42 - Equivalent equivalent circuit zero
Sequences
To solve the problem, we use equivalent data in a direct sequence from the previous problem. Taking into account the features of K (1.1), we obtain the scheme shown in Figure 43. This scheme is reduced to the form shown in Figure 44.
a) The concept of vectors
In fig. 1-4 shows the curve of alternating current in time. The current first increases from zero (at = 0 °) to the maximum positive value + IM (at = 90 °), then decreases, passes through zero (at = 180 °), reaches the maximum negative value - IM (at = 270 °) and Finally, it returns to zero (at = 360 °). After that, the whole cycle of current change is repeated.
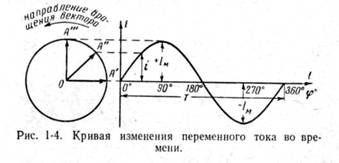
The curve of change of alternating current in time, constructed on fig. 1-4, is called a sinusoid. The time T, during which a full cycle of current change occurs, corresponding to a change in angle of up to 360 °, is called the alternating current period. The number of periods for 1 s is called the frequency of the alternating current. In industrial installations and in everyday life in the USSR and in other European countries mainly used alternating current with a frequency of 50 Hz. This current takes 50 times per second in a positive and negative direction.
The change in AC current over time can be written as follows:
where i is the instantaneous current value, i.e. the current value at each time point; I m - the maximum current value; - angular frequency of alternating current, f = 50 Hz, = 314; - the initial angle corresponding to the point in time from which the time begins (at t = 0).
For the particular case shown in Fig. 1-4,
Analyzing the action of relay protection and automation devices, it is necessary to compare currents and voltages, add or subtract them, determine the angles between them, and perform other operations. To use the curves similar to the one shown in fig. 1-4, is inconvenient, since the construction of current and voltage sine waves takes a lot of time and does not provide a simple and visual result. Therefore, for simplicity, it is customary to depict currents and voltages as straight line segments having a certain length and direction, the so-called vectors (OA in Fig. 1-4). One end of the vector is fixed at the point O - the origin, and the other rotates counterclockwise.
The instantaneous value of the current or voltage at each moment of time is determined by the projection on the vertical axis of the vector, the length of which is equal to the maximum value of the electrical magnitude of the current or voltage. This projection will become either positive or negative, taking the maximum values with the vertical arrangement of the vector.
During the time T, equal to the period of alternating current, the vector will make a full revolution around the circumference (360 °), taking consecutive positions, etc. At an alternating current frequency of 50 Hz, the vector will perform 50 revolutions per second.
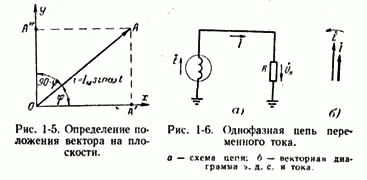
Thus, the vector of current or voltage is a straight line segment, equal in magnitude to the maximum value of current or voltage, rotating relative to the point O counterclockwise, moving clockwise at a speed determined by the frequency of the alternating current. Knowing the position of the vector at each moment in time, you can determine the instantaneous value of current or voltage at the moment. So, for the position of the current vector OA, shown in Fig. 1-5, its instantaneous value is determined by the projection on the vertical axis, i.e.
Based on fig. 1-5, it can also be said that the current at a given time has a positive value. However, this still does not give a complete picture of the process in the AC circuit, since it is not known what a positive or negative current means, a positive or negative voltage.
In order for the vector diagrams of currents and voltages to give a complete picture, they need to be linked to the actual process flow in the AC circuit, i.e., the conditional positive directions of currents and voltages must be adopted in the circuit in question.
Without fulfilling this condition, if positive directions of currents and voltages are not given, any vector diagram does not make any sense.
Consider a simple single-phase AC circuit shown in fig. 1-6, and. From a single-phase generator, the energy is transferred to the active resistance of the load R. Let us set positive directions of currents and voltages in the circuit under consideration.
For the conditional positive direction of the voltage and e d. we take the direction when the potential of the output of the generator or the load connected to the line is higher than the potential of the output connected to ground. In accordance with the rules adopted in electrical engineering, a positive direction for e. d. is indicated by an arrow directed towards a higher potential (from ground to a linear output), and for voltage - by an arrow directed towards a lower potential (from a linear output to ground).
Construct vectors e. d. and the current characterizing the operation of the circuit under consideration (Fig. 1-6, b). Vector e. d. arbitrarily denote the vertical line with the arrow pointing upwards. To construct the current vector, we write the equation for the circuit according to the second Kirchhoff law:
Since the signs of the current vectors and e. d. in expression (1-7) coincide, the current vector will coincide with the vector e. d. and in fig. 1-6, b.
Here and in the future, when constructing vectors, we will postpone them in magnitude equal to the effective value of current and voltage, which is convenient for performing various mathematical operations with vectors. As is known, the effective values of current and voltage are less than the corresponding maximum (amplitude) values.
For given positive directions of current and voltage, the sign of power is unambiguously determined. In this case, the power from the generator buses to the line will be considered positive:
as the current vectors and e. d. in fig. 1-6, b match.
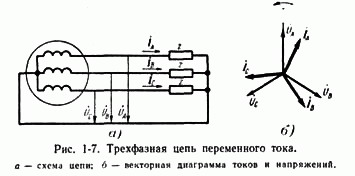
Similar considerations can be made for the three-phase AC circuit, shown in Fig. 1-7, and.
In this case, the same positive directions are taken in all phases, which corresponds to the symmetric diagram of currents and voltages shown in fig. 1-7, b. Note that a three-phase system of vectors is called symmetric, when all three vectors are equal to the magnitude and are shifted relative to each other by an angle of 120 °.
Generally speaking, it is not at all necessary to take the same positive directions in all phases. However, it is inconvenient to accept different positive directions in different phases, since it would be necessary to depict an asymmetrical system of vectors when the electric circuit operates in a normal symmetric mode, when all three phases are under the same conditions.
b) Vector operations
When we consider only one current or voltage curve, the initial value of the angle from which the counting begins or, in other words, the position of the vector in the diagram corresponding to the initial moment of time can be taken arbitrary. If two or more currents and voltages are simultaneously considered, then, having set the initial position on the diagram of one of the vectors, we thereby determine the position of all the other vectors.
All three vectors of phase voltages shown in fig. 1-7, b, rotate counterclockwise with the same speed determined by the frequency of the alternating current. At the same time, they intersect the vertical axis, which coincides with the direction of the vector in Fig. 1-7, b, alternately with a specific sequence, namely, which is called the alternation of the voltage phases (or current).
In order to determine the relative position of two vectors, it is usually said that one of them is ahead of or behind the other. In this case, the leading vector is considered to be the one that, when rotated counterclockwise, will cross the vertical axis earlier. So, for example, we can say that the voltage vector in fig. 1-7, b is 120 ° ahead of the angle, or, on the other hand, the vector is 120 ° behind the vector. As can be seen from fig. 1-7, the expression “vector lags an angle of 120 °” is equivalent to the expression “a vector is ahead of an angle of 240 °”.
When analyzing various electrical circuits, it is necessary to add or subtract the current and voltage vectors. The addition of vectors is performed by geometric summation according to the parallelogram rule, as shown in Fig. 1-8, and on which the sum of currents is built

Since subtraction is the reverse of addition, it’s obvious that to determine the difference in currents (for example, it’s enough to add a vector to the current
At the same time on fig. 1-8, and it is shown that the vector of the difference of currents can be constructed more simply by connecting the ends of the vectors with a line. The arrow of the vector of the difference of currents is directed towards the first vector, i.e.
The vector diagram of interphase voltages is constructed in a completely similar way, for example ![]() (fig. 1-8, b).
(fig. 1-8, b).
|
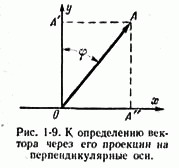
Obviously, the position of a vector on a plane is determined by its projections onto any two axes. For example, in order to determine the position of the OA vector (Fig. 1-9), it is enough to know its projections on mutually perpendicular axes.
![]()
Put the projections of the vector on the axes of coordinates and reconstruct the perpendiculars to the axes from the points. The point of intersection of these perpendiculars is the point A - one end of the vector, the second end of which is the point O - the origin.
c) Purpose of vector diagrams
Workers involved in the design and operation of relay protection very often have to use in their work the so-called vector diagrams - vectors of currents and voltages, built on a plane in a certain combination, corresponding to the electrical processes occurring in the considered scheme.
The vector diagrams of currents and voltages are constructed in the calculation of short circuits, in the analysis of current distribution in normal mode.
|

Analysis of vector diagrams of currents and voltages is one of the main, and in some cases the only way to check the correctness of the connection of current and voltage circuits and turn on the relay in differential and directional protection circuits.
In fact, building a vector diagram is advisable in all cases when two or more electrical quantities are applied to the relay in question: the difference in current in the maximum current or differential protection, the current and voltage in the power direction relay or in the directional relay. The vector diagram allows you to make a conclusion on how the protection in question will work during a short circuit, that is, to evaluate the correctness of its inclusion. The mutual arrangement of the currents and voltages vectors on the diagram is determined by the characteristic of the circuit under consideration, as well as the conditionally accepted positive directions of currents and voltages.
For example, consider two vector diagrams.
|
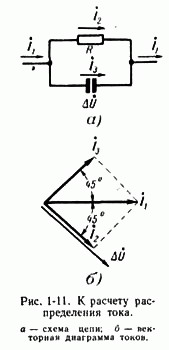
In fig. 1-10, and a single-phase AC circuit is shown, consisting of a generator and capacitive active and inductive impedances connected in series (let us assume that inductive impedance is greater than capacitive x L\u003e x C). The positive directions of currents and voltages, as well as in the cases discussed above, are indicated in fig. 1-10, and the arrows. Construction of the vector diagram will begin with the vector e. D. s, which is located in Fig. 1-10, b vertically. The magnitude of the current passing in the circuit in question is determined from the following expression:
![]()
Since in the considered circuit there are active and reactive resistances, with x L\u003e x C, the current vector lags behind the voltage vector by the angle:
In fig. 1-10, b, a vector is constructed lagging behind the vector at an angle of 90 °. Voltage at point n determined by the difference of vectors. The voltage at point m is determined in the same way:
![]()
|
d) Vector diagrams in the presence of transformation
If there are transformers in the electrical circuit, it is necessary to introduce additional conditions in order to compare the vector diagrams of currents and voltages on different sides of the transformer. The positive directions of the currents should be set taking into account the polarity of the transformer windings.
Depending on the winding direction of the transformer windings, the mutual direction of the currents in them changes. In order to determine the direction of the currents in the windings of a power transformer and compare them with each other, the windings of the transformer are given the symbols "start" and "end".
Let's draw the scheme shown in fig. 1-6, only between the source e. d. and the load will turn on the transformer (Fig. 1-12, a). Denote the beginning of the windings of a power transformer by the letters A and a, the ends are X and x. It should be borne in mind that the "beginning" of one of the windings is taken arbitrarily, and the second is determined on the basis of the conditional positive directions of the currents given for both windings of the transformer. 1-12, and the positive directions of currents in the windings of power transformers are indicated. In the primary winding, the direction of the current from the “beginning” to the “end” is considered positive, and in the secondary winding - from the “end” to “beginning”.

As a result, with such positive directions, the direction of the current in the load resistance remains the same as before switching on the transformer (see fig. 1-6 and 1-12).
where are the magnetic fluxes in the transformer magnetic cores, and are the magnetizing forces creating these fluxes (nc).
From the last equation
According to equality (1-11), the vectors have the same signs and, therefore, will coincide in direction (Fig. 1-12, b).
The accepted positive directions of currents in the transformer windings are convenient because the primary and
The secondary currents in the vector diagram coincide in direction (Figure 1-12, b). For voltages, it is also convenient to accept such positive directions so that the vectors of the secondary and primary voltages coincide, as shown in Fig. 1-12.
In this case, there is a connection of the transformer according to the scheme 1 / 1-12. Accordingly, for a three-phase transformer, the wiring diagram and the vector diagram of currents and voltages are shown in fig. 1-14.
In fig. 1-15 b used to construct vector voltage diagrams corresponding to the transformer connection scheme

On the high voltage side, where the windings are connected in a star, the phase to phase voltages are higher than the phase voltages. On the low voltage side, where the windings are connected in delta, the phase to phase and phase voltages are equal. The interfacial voltages of the low voltage side are 30 ° behind the same interfacial voltages of the higher voltage side, which corresponds to the wiring diagram
For the considered connection scheme of transformer windings, it is possible to construct vector diagrams of currents passing from both its sides. It should be borne in mind that, on the basis of the conditions we have adopted, only the positive directions of the currents in the transformer windings are determined. The positive directions of the currents in the linear wires connecting the leads of the transformer's low voltage windings to the buses can be taken arbitrarily, regardless of the positive directions of the currents passing in the triangle.
So, for example, if we take the positive directions of the currents in the phases on the low voltage side from the delta-connected terminals to the buses (Figure 1-15, a), we can write the following equalities:
The corresponding vector current diagram is shown in fig. 1-15, c.
|
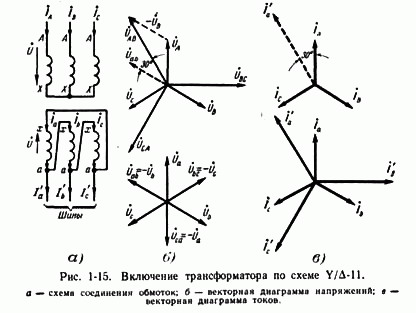
Similarly, it is possible to construct a vector diagram of currents for the case when the positive directions of the currents are taken from the busbars to the outputs of the triangle (Fig. 1-16, a). The following equalities correspond to this case:
and vector diagrams shown in fig. 1-16 b. Comparing the current charts given in fig. 1-15, c and 1-16, b, it can be concluded that the vectors of the phase currents passing in the wires connecting the terminals of the windings are low
The voltage of the transformer and the bus are in anti-tivophase. Of course, both those and other diagrams are correct.
Thus, if there are triangle-connected windings in the circuit, it is necessary to specify the positive directions of the currents in both the windings themselves and in the linear wires connecting the triangle to the buses.

In this case, when determining the group of connections of a power transformer, it is convenient to take positive directions from the low voltage leads to the buses, since the current vector diagrams coincide with the accepted designation of the power transformer connection groups (compare Fig. 1-15, b and c). Similarly, vector current charts can be constructed for other power transformer connection groups. The above rules for constructing vector diagrams of currents and voltages in circuits with transformers are also valid for current and voltage measuring transformers.